This is a residual unexplained variability (RUV) model function that encodes the model described above.
The function is suitable for input to the create.poped.database function using the
fError_file argument.
Arguments
- model_switch
a vector of values, the same size as
xt, identifying which model response should be computed for the corresponding xt value. Used for multiple response models.- xt
a vector of independent variable values (often time).
- parameters
A named list of parameter values.
- epsi
A matrix with the same number of rows as the
xtvector, columns match the numbers defined in this function.- poped.db
a poped database. This can be used to extract information that may be needed in the model file.
Value
A list consisting of:
y the values of the model at the specified points.
poped.db A (potentially modified) poped database.
See also
Other models:
feps.add.prop(),
feps.prop(),
ff.PK.1.comp.oral.md.CL(),
ff.PK.1.comp.oral.md.KE(),
ff.PK.1.comp.oral.sd.CL(),
ff.PK.1.comp.oral.sd.KE(),
ff.PKPD.1.comp.oral.md.CL.imax(),
ff.PKPD.1.comp.sd.CL.emax()
Other RUV_models:
feps.add.prop(),
feps.prop()
Examples
library(PopED)

## find the parameters that are needed to define from the structural model
ff.PK.1.comp.oral.sd.KE
#> function (model_switch, xt, parameters, poped.db)
#> {
#>     with(as.list(parameters), {
#>         y = xt
#>         y = (DOSE * Favail * KA/(V * (KA - KE))) * (exp(-KE *
#>             xt) - exp(-KA * xt))
#>         return(list(y = y, poped.db = poped.db))
#>     })
#> }
#> <bytecode: 0x55707d7bec00>
#> <environment: namespace:PopED>

## -- parameter definition function
## -- names match parameters in function ff
sfg <- function(x,a,bpop,b,bocc){
  parameters=c(KE=bpop[1]*exp(b[1]),
               V=bpop[2]*exp(b[2]),
               KA=bpop[3]*exp(b[3]),
               Favail=bpop[4],
               DOSE=a[1])
  return(parameters)
}

## -- Define initial design  and design space
poped.db <- create.poped.database(ff_fun=ff.PK.1.comp.oral.sd.KE,
                                  fg_fun=sfg,
                                  fError_fun=feps.add,
                                  bpop=c(KE=0.15/8, V=8, KA=1.0, Favail=1),
                                  notfixed_bpop=c(1,1,1,0),
                                  d=c(KE=0.07, V=0.02, KA=0.6),
                                  sigma=1,
                                  groupsize=32,
                                  xt=c( 0.5,1,2,6,24,36,72,120),
                                  minxt=0,
                                  maxxt=120,
                                  a=70)

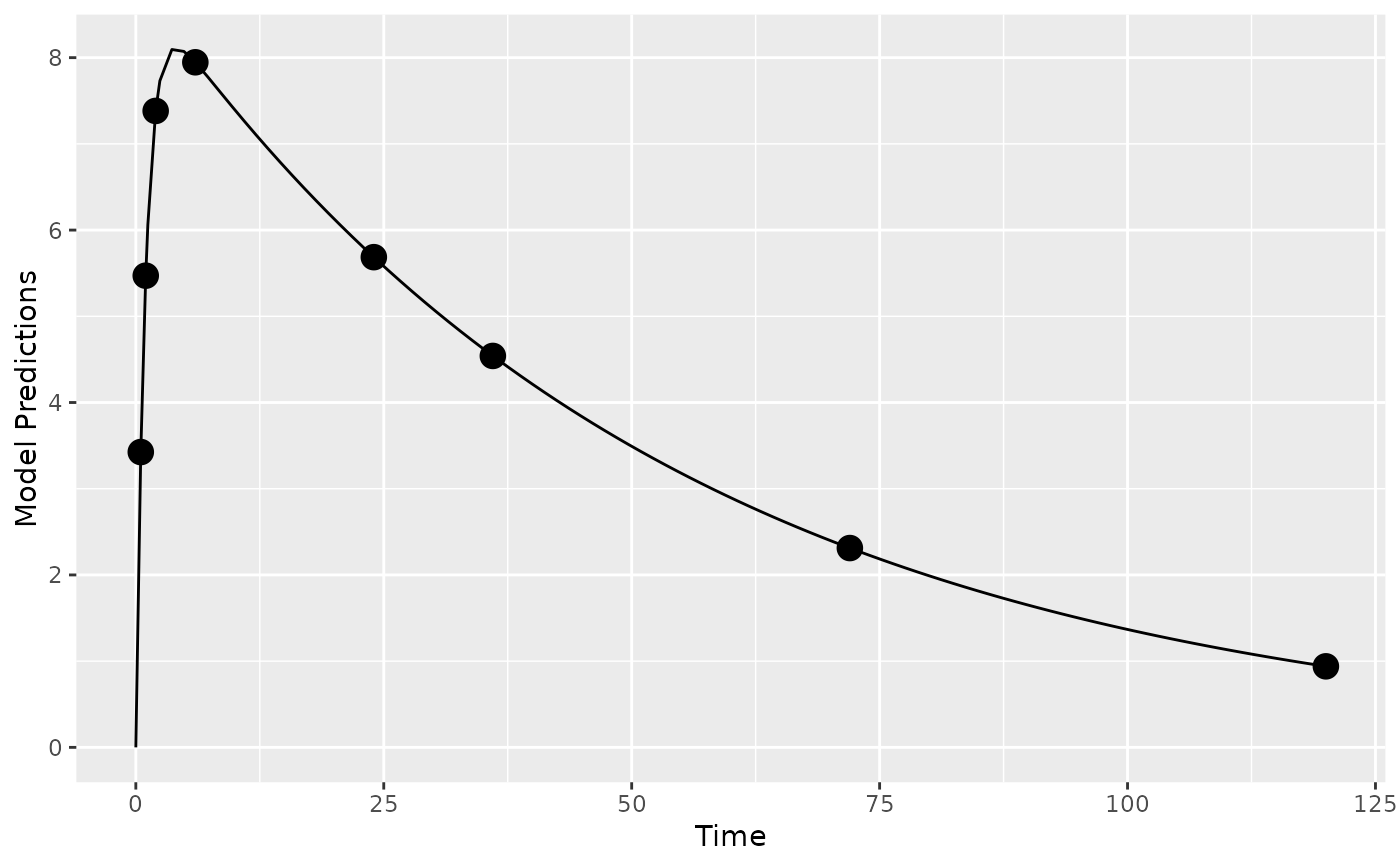
##  create plot of model without variability
plot_model_prediction(poped.db)


## evaluate initial design
FIM <- evaluate.fim(poped.db)
FIM
#>             [,1]        [,2]       [,3]        [,4]        [,5]      [,6]
#> [1,] 746643.9218 1031.526838 485.621863    0.000000     0.00000  0.000000
#> [2,]   1031.5268   16.667994  -3.901736    0.000000     0.00000  0.000000
#> [3,]    485.6219   -3.901736  47.787464    0.000000     0.00000  0.000000
#> [4,]      0.0000    0.000000   0.000000 1076.594563   374.07924  1.295445
#> [5,]      0.0000    0.000000   0.000000  374.079240 17780.60889 15.223541
#> [6,]      0.0000    0.000000   0.000000    1.295445    15.22354 35.681901
#> [7,]      0.0000    0.000000   0.000000   47.625531   142.44395  2.089439
#>            [,7]
#> [1,]   0.000000
#> [2,]   0.000000
#> [3,]   0.000000
#> [4,]  47.625531
#> [5,] 142.443949
#> [6,]   2.089439
#> [7,]  86.372695
det(FIM)
#> [1] 2.960928e+19
get_rse(FIM,poped.db)
#>         KE          V         KA       d_KE        d_V       d_KA SIGMA[1,1]
#>   6.508287   3.248953  14.728214  44.184490  37.841158  27.924203  10.959023
